Getting D3.js up and running is simpler, but setting it up right can save you a lot of headaches down the line. The core of D3 is a small library that binds data to DOM elements and applies transformations based on that data. It’s not a charting library per se; it’s more like a powerful toolkit for manipulating document elements based on data. So the first step is to make sure the environment is ready to handle that.
You want to start by including the D3 library in your project. The easiest way is through a CDN, which keeps your setup minimal and lets you focus on the code instead of package management. Put this line in your HTML’s or just before your closing tag:
<script src="https://d3js.org/d3.v7.min.js"></script>
This pulls in the latest stable version of D3. From here, it’s a matter of writing JavaScript that selects DOM elements and binds data to them. D3 expects the page to be structured in a way that can accommodate SVG elements, so you’ll want to set up a container element in your HTML where the visualization will live. Typically, a simple
<div id="chart-area"></div>
Inside your JavaScript, you’ll use D3 to append an SVG element to that container. This SVG becomes your canvas. It’s scalable, resolution-independent, and supports all the vector graphics operations you need.
Here is how you can create an SVG canvas with a fixed width and height, which will serve as the base for your bar chart:
const svgWidth = 600;
const svgHeight = 400;

const svg = d3.select("#chart-area")
  .append("svg")
  .attr("width", svgWidth)
  .attr("height", svgHeight);
One subtle but important point: D3’s default coordinate system starts at the top-left corner (0,0), with x increasing to the right and y increasing downwards. This means when you build charts, your axes and scales need to account for that orientation. You’ll commonly invert the y-axis scale later to get the bars growing upwards.
Before you jump into data binding, get comfortable with D3’s selection and data join pattern. It’s the backbone of how D3 works:
const data = [10, 20, 30, 40, 50];

const bars = svg.selectAll("rect")
  .data(data)
  .enter()
  .append("rect");
This snippet grabs all rect elements in the SVG (none exist initially), binds the data array, then enters the data join to append a rectangle for each data point. From here, you’ll specify attributes like position, width, height, and style to shape your bars.
Finally, set up scales for mapping data values to pixel values. D3’s scale functions make it painless. For a bar chart, you’ll usually create a band scale for the x-axis to space the bars evenly and a linear scale for the y-axis to adjust bar heights. Here’s the basic setup:
const xScale = d3.scaleBand()
  .domain(data.map((d, i) => i))
  .range([0, svgWidth])
  .padding(0.1);

const yScale = d3.scaleLinear()
  .domain([0, d3.max(data)])
  .range([svgHeight, 0]); // Notice range is inverted for y-axis
With these scales, you can calculate each bar’s position and size reliably, regardless of data changes. This separation of concerns—scales handling data-to-pixel mapping, SVG handling rendering—keeps your code modular and easier to debug.
Now that the environment is set, and you have the basic building blocks for selecting elements, binding data, and scaling values, you’re ready to start crafting the actual bars and axes. The key here is to keep your code declarative and leverage D3’s chaining for succinctness and readability. Next, we’ll move on to building the bar chart itself…
Oura Ring 5 Sizing Kit - Size Before You Buy Oura Ring 5 - Unique Sizing, Not Standard Ring Sizing - Receive Amazon Credit for Oura Ring 5 Purchase
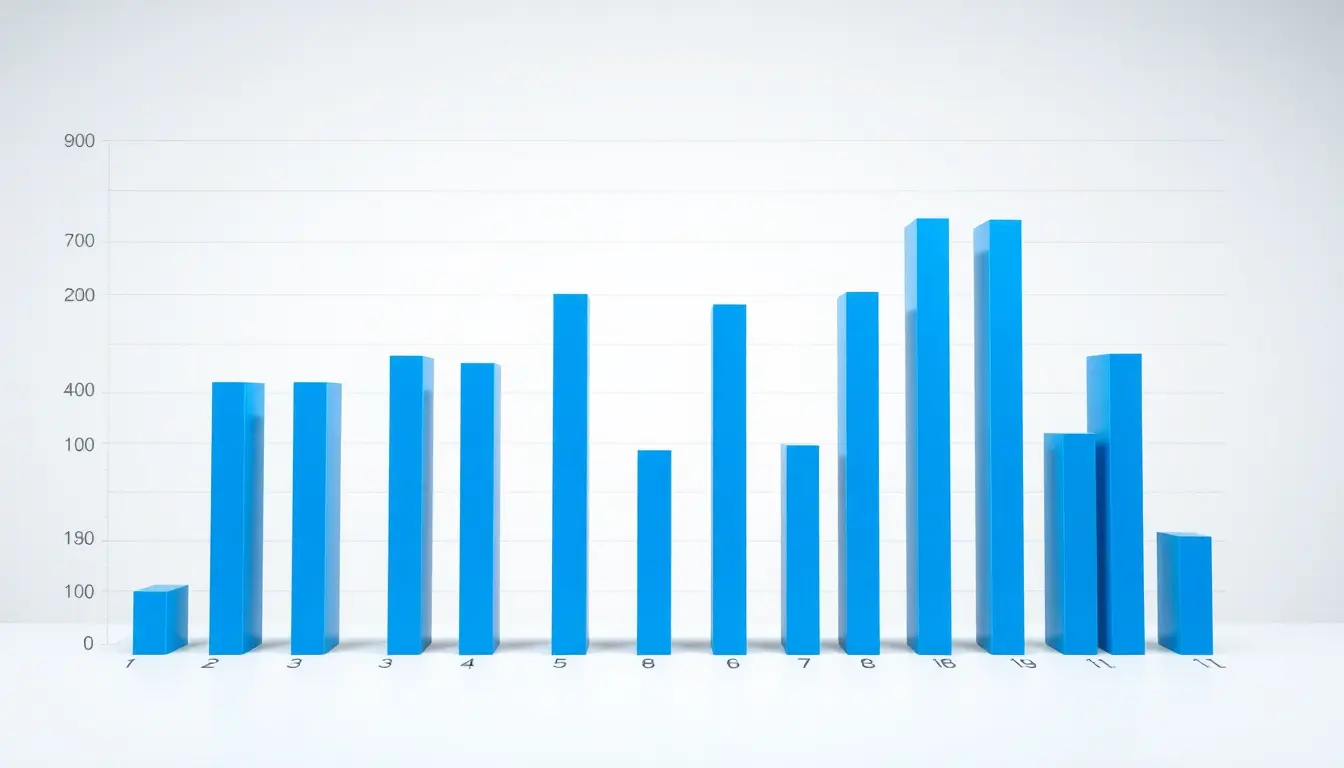
$10.00 (as of July 20, 2026 03:55 GMT +00:00 - More infoProduct prices and availability are accurate as of the date/time indicated and are subject to change. Any price and availability information displayed on [relevant Amazon Site(s), as applicable] at the time of purchase will apply to the purchase of this product.)Building the bar chart with scalable vector graphics
To create the bars in the chart, you can set attributes on the rectangles that represent your data. Each rectangle’s position on the x-axis can be determined by the x-scale, and its height can be determined by the y-scale. Here’s how you can do that:
bars.attr("x", (d, i) => xScale(i))
    .attr("y", d => yScale(d))
    .attr("width", xScale.bandwidth())
    .attr("height", d => svgHeight - yScale(d))
    .attr("fill", "steelblue");
This code snippet sets the x and y positions based on the scales defined earlier, assigns a width using the bandwidth method of the band scale, and calculates the height by subtracting the scaled value from the SVG height. This way, the bars grow upwards as expected.
Once the bars are rendered, you might want to add axes for better context. D3 provides convenient methods for creating axes. You can create both x and y axes using the scales defined previously. Here’s how to do it:
const xAxis = d3.axisBottom(xScale);
const yAxis = d3.axisLeft(yScale);

svg.append("g")
    .attr("class", "x-axis")
    .attr("transform", translate(0, ${svgHeight}))
    .call(xAxis);

svg.append("g")
    .attr("class", "y-axis")
    .call(yAxis);
This code appends groups for the axes to the SVG, positions the x-axis at the bottom of the chart, and calls the axis functions to render them. The class attributes allow for easy styling with CSS if needed.
As you work with D3, you’ll find that transitions can bring your visualizations to life. For example, you can animate the bars when updating data. Here’s a simple way to apply a transition to the bar heights:
bars.transition()
    .duration(750)
    .attr("y", d => yScale(d))
    .attr("height", d => svgHeight - yScale(d));
This transition smoothly updates the position and height of the bars over 750 milliseconds whenever the data changes. It’s a powerful way to enhance user experience and make your visualizations more engaging.
Finally, consider adding tooltips to provide additional information when users hover over the bars. This can be accomplished by appending a div element that displays the data value:
const tooltip = d3.select("body").append("div")
    .attr("class", "tooltip")
    .style("opacity", 0);

bars.on("mouseover", function(event, d) {
        tooltip.transition()
            .duration(200)
            .style("opacity", .9);
        tooltip.html(d)
            .style("left", (event.pageX + 5) + "px")
            .style("top", (event.pageY - 28) + "px");
    })
    .on("mouseout", function(d) {
        tooltip.transition()
            .duration(500)
            .style("opacity", 0);
    });
This code snippet creates a tooltip that appears when a user hovers over a bar, displaying the corresponding data value. The tooltip fades in and out smoothly, improving the interactivity of your chart.
Now you have a fully functional bar chart built with D3.js. You can expand upon this foundation by exploring more complex data sets, incorporating different types of visualizations, or applying more advanced features such as filtering and sorting data dynamically. D3’s flexibility allows you to iterate and refine your visualizations based on your application’s needs.
Post navigation
Previous Post
 Beginning JavaScript Syntax
Next Post