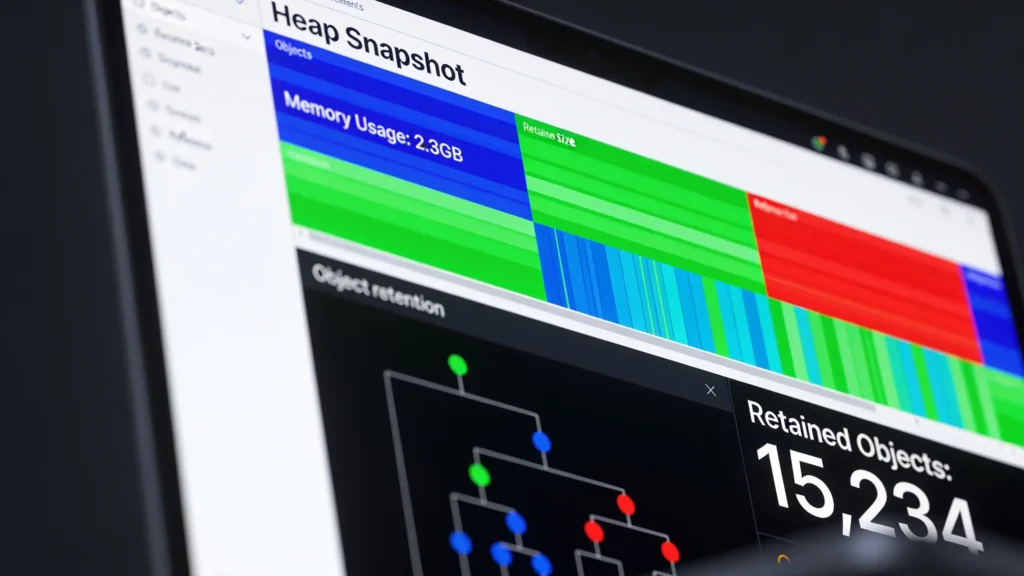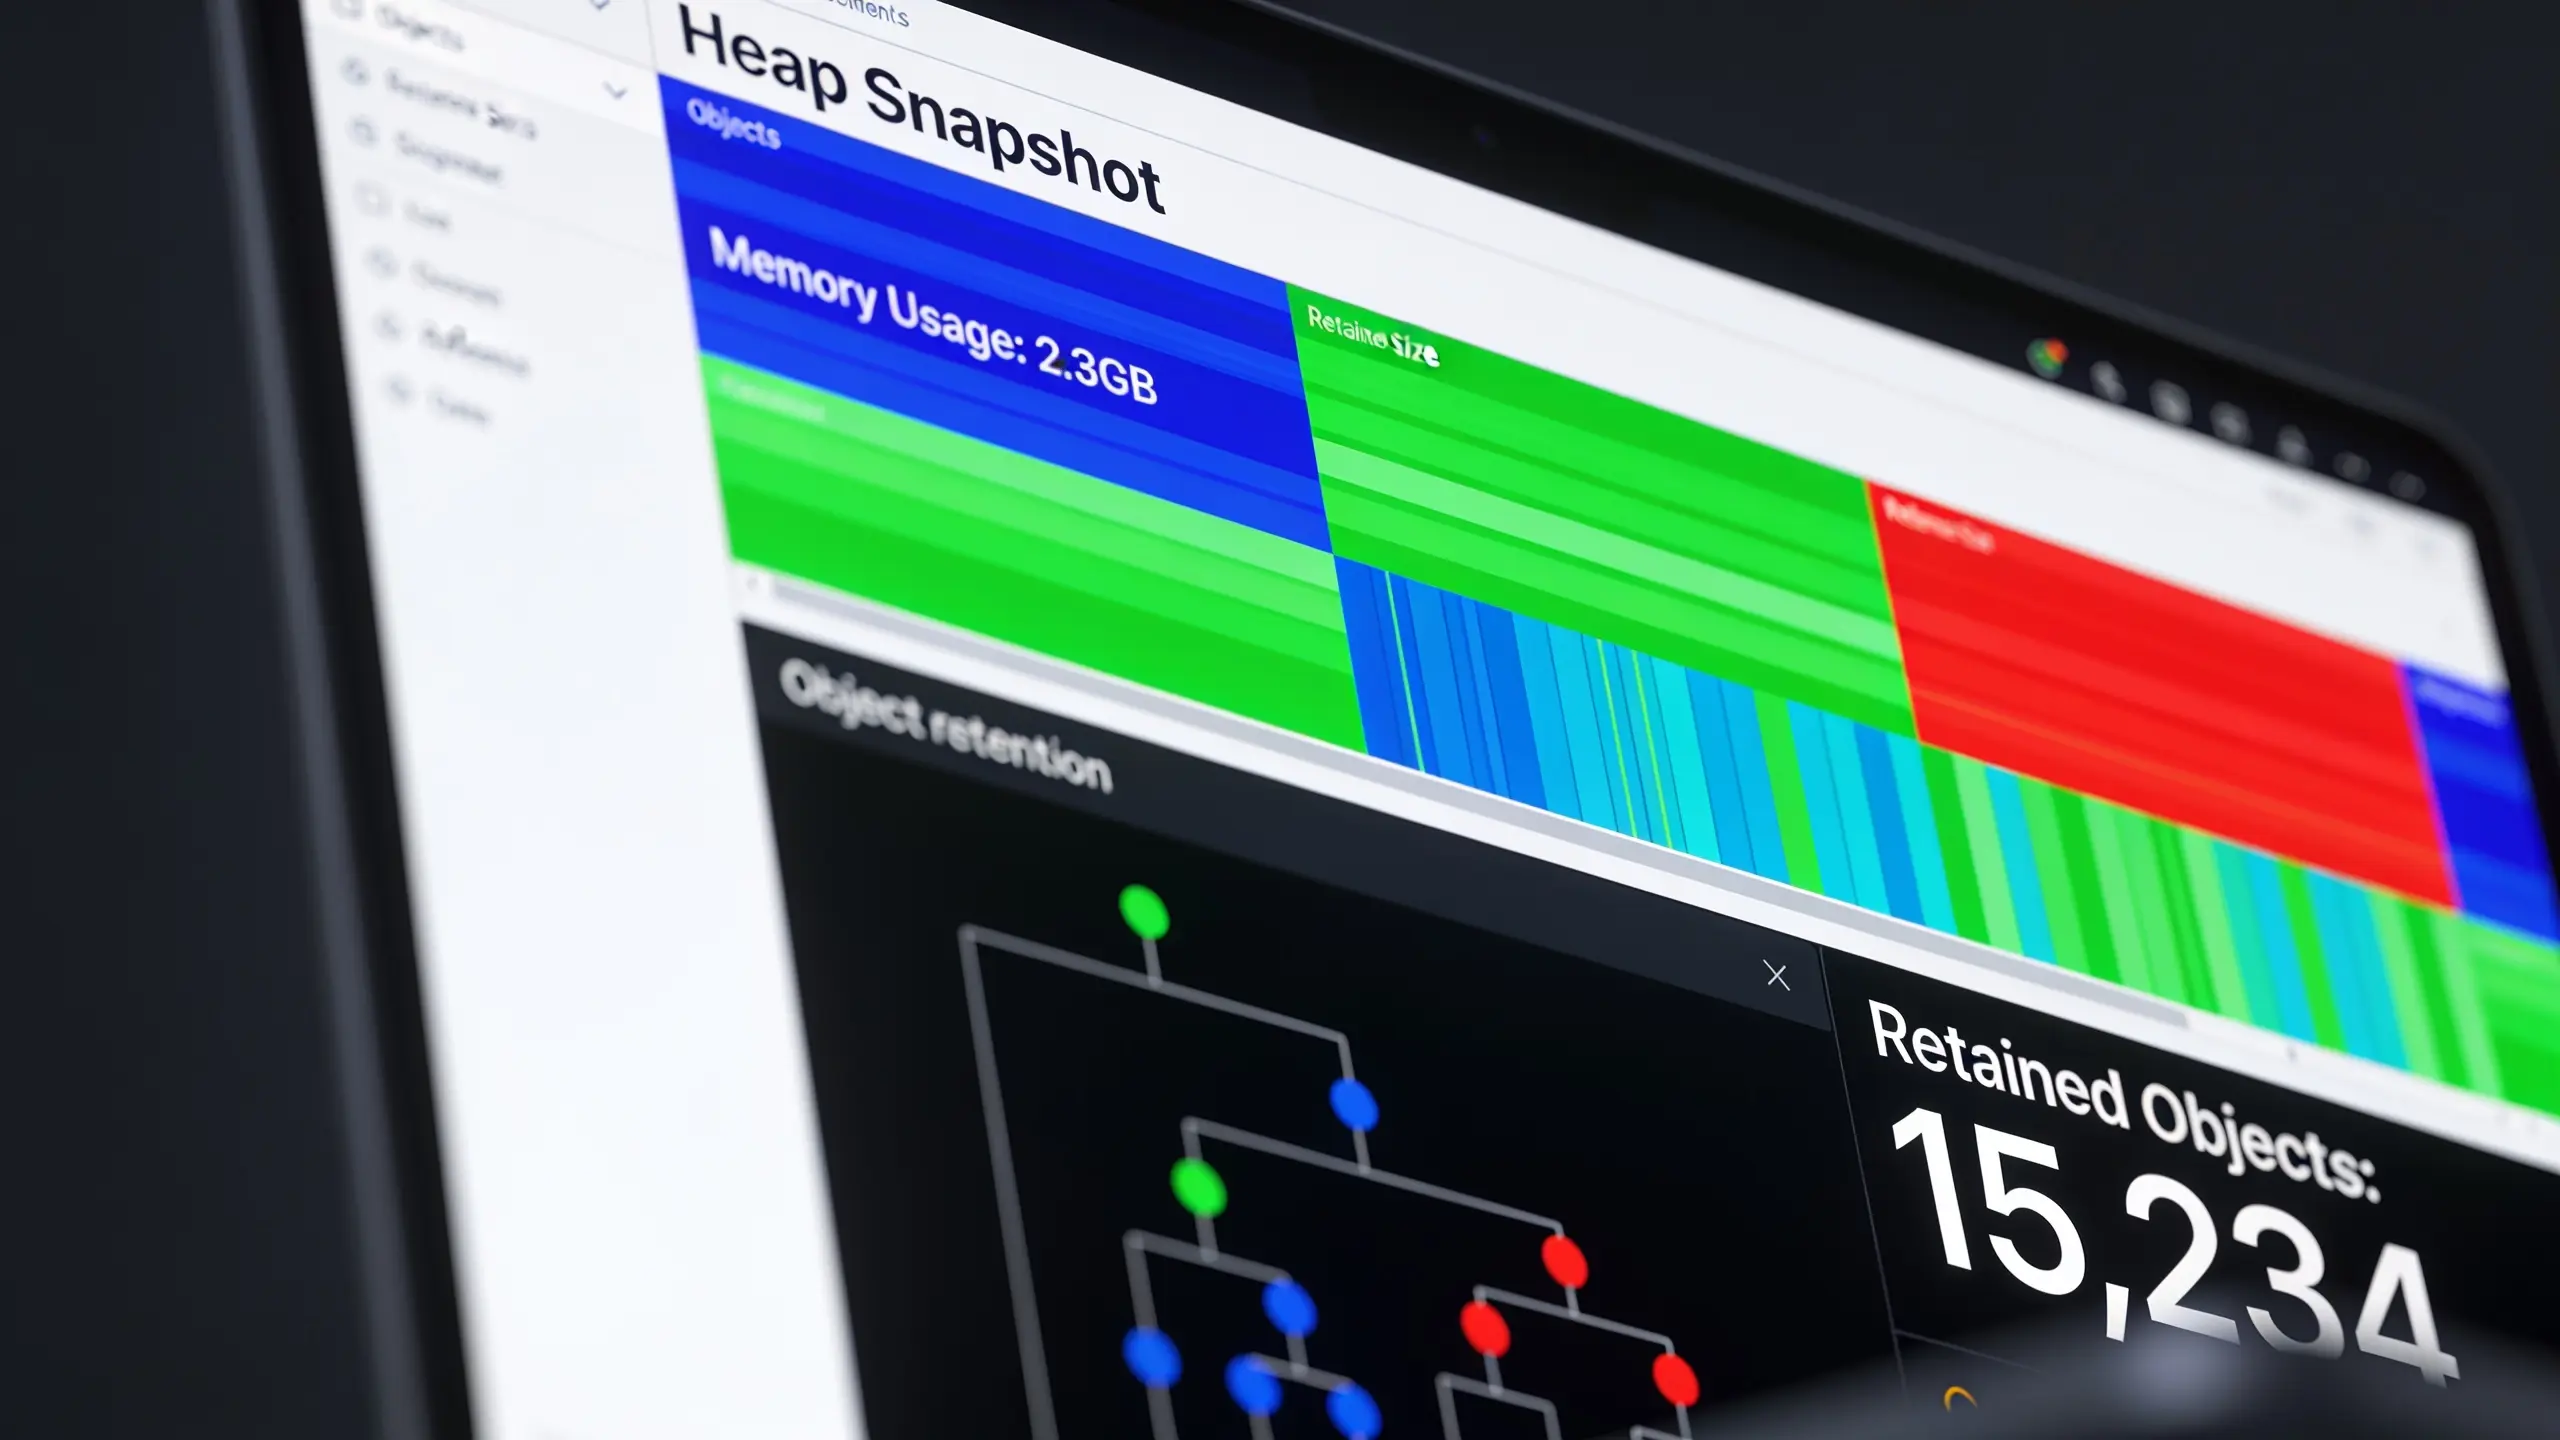
Heap snapshots are invaluable tools for analyzing memory usage in applications. They allow developers to capture the state of the memory heap at a specific point in time, providing insights into how memory is allocated and used by various objects.
To generate a heap snapshot in a JavaScript environment, you can use the Chrome DevTools. Simply open the DevTools, navigate to the ‘Memory’ tab, and select ‘Take snapshot’. This will capture the current state of the heap, which you can then analyze for various metrics.
Once you have a snapshot, you can look for objects that are retained in memory longer than necessary. This can indicate potential memory leaks. By comparing snapshots taken at different times, you can identify objects that accumulate and never get garbage collected.
Here is a basic example of how you might programmatically take a snapshot in a JavaScript application using the DevTools API:
const { performance } = require('perf_hooks');
const snapshot = performance.memory;
// Take a memory snapshot
console.log(snapshot);
In addition to capturing snapshots, you can also use tools like Node.js’s built-in ‘v8’ module to analyze memory usage. The ‘v8’ module provides methods to get heap statistics and can be helpful in understanding memory behavior in server-side applications.
const v8 = require('v8');
const heapStats = v8.getHeapStatistics();
console.log(heapStats);
When analyzing heap snapshots, pay close attention to the ‘retained size’ of objects. This metric indicates how much memory is retained because of a particular object, which can help pinpoint the culprits of memory leaks.
Memory leaks often occur when event listeners are not properly removed, or when closures hold references to large objects that are no longer needed. Identifying these patterns is important for maintaining optimal application performance.
Using tools like Chrome’s allocation timeline can also help visualize memory allocation over time, making it easier to spot trends and abnormal memory spikes. This can guide you in optimizing your code and ensuring that memory is efficiently managed throughout the application’s lifecycle.
Another strategy involves using weak references, which allow you to reference an object without preventing it from being garbage collected. This can be useful in scenarios where you want to cache data but do not want to create a strong reference that could lead to leaks.
let cache = new WeakMap();
function cacheData(key, value) {
  cache.set(key, value);
}
By taking regular snapshots and analyzing them, you can create a feedback loop that helps you continually improve your memory management practices. This proactive approach can lead to a more responsive and stable application.
As you dive deeper into heap analysis, consider integrating automated tools that can run memory checks as part of your continuous integration pipeline. This ensures that memory leaks are caught early, before they can impact users.
Finally, remember that understanding the nuances of memory allocation and garbage collection can significantly enhance your ability to write efficient code. The more you familiarize yourself with these concepts, the better equipped you’ll be to tackle complex memory management challenges.

6 Pack Sport Bands Compatible with Apple Watch Band 38mm 40mm 41mm 42mm 44mm 45mm 49mm 46mm,Silicone Waterproof Strap for iWatch Apple Watch Series 11 10 9 Ultra 8 7 6 5 4 3 2 1 SE Women Men
$8.49 (as of July 11, 2026 03:15 GMT +00:00 - More infoProduct prices and availability are accurate as of the date/time indicated and are subject to change. Any price and availability information displayed on [relevant Amazon Site(s), as applicable] at the time of purchase will apply to the purchase of this product.)Identifying and resolving memory leaks with precision
To identify memory leaks effectively, start by examining the object graphs in your heap snapshots. Look for objects that should have been released but are still retained. This often leads to discovering unintended references that prevent garbage collection.
Using the ‘retainers’ view in Chrome DevTools can also provide insights into why certain objects are not being collected. By selecting an object and viewing its retainers, you can trace the path of references that keep it alive.
Here’s a practical example of how to visualize the retention of objects:
const obj1 = { name: "Instance 1" };
const obj2 = { name: "Instance 2", ref: obj1 };

// obj1 is retained by obj2
console.log(obj2.ref.name); // Outputs: Instance 1
In this scenario, if obj2 is not released, obj1 will remain in memory, leading to a leak. To mitigate this, ensure that you nullify references when they are no longer needed:
function releaseReferences() {
  obj2.ref = null; // Release reference to obj1
}
Closures can also be a common source of memory leaks. If a closure captures a large object and is not properly cleaned up, it can prevent that object from being garbage collected. Analyze your closures carefully to ensure they do not hold onto unnecessary references.
Consider using tools like the ‘Memory Leak Detector’ library, which can help automate the detection of common leak patterns. It can provide alerts when certain thresholds of memory usage are exceeded, allowing for quicker intervention.
const leakDetector = require('memory-leak-detector');

leakDetector.start({
  threshold: 100 * 1024 * 1024, // 100 MB
  onLeakDetected: () => {
    console.warn("Memory leak detected!");
  }
});
Additionally, using profiling tools can help you understand the memory usage of your application in real-time. Profilers can show you how memory usage changes over time and identify which functions are consuming the most memory.
When you identify a suspect function, consider breaking it down into smaller, more manageable pieces. This not only aids in understanding but also allows for easier identification of memory issues within specific parts of the code.
For example, if you have a function that processes large datasets, ensure that you are properly managing memory within that function:
function processData(data) {
  // Process data here
  // Ensure no references are kept to large objects after processing
  data = null; // Help garbage collector
}
Another effective technique is to use profiling tools like the Chrome DevTools ‘Performance’ tab to record JavaScript execution. This allows you to see how memory allocation correlates with function calls, giving you a clearer picture of where leaks may be occurring.
As you refine your memory management strategy, ensure that you document your findings and the solutions you implement. This record will be invaluable for future debugging and optimization efforts.