Posted inMemory Management
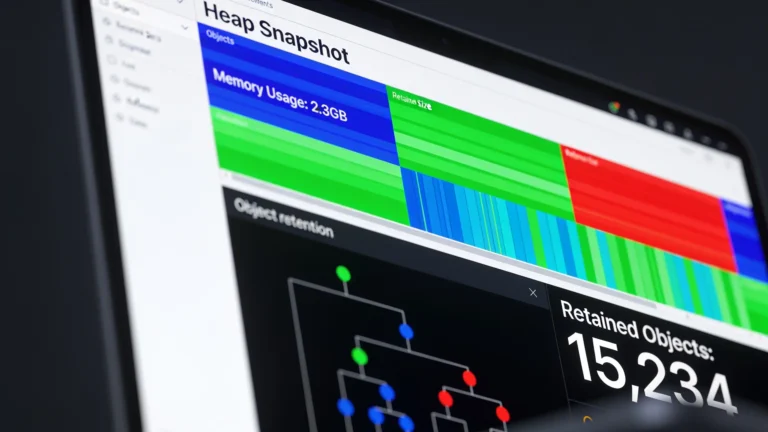
How to use heap snapshots to debug memory leaks in JavaScript
Identify memory leaks by examining object graphs in heap snapshots and using the 'retainers' view in Chrome DevTools. Key techniques include nullifying references, analyzing closures, and utilizing tools like the 'Memory Leak Detector' library. Profiling tools help monitor memory usage and optimize functions to prevent leaks.