How to debug closures in JavaScript using DevTools

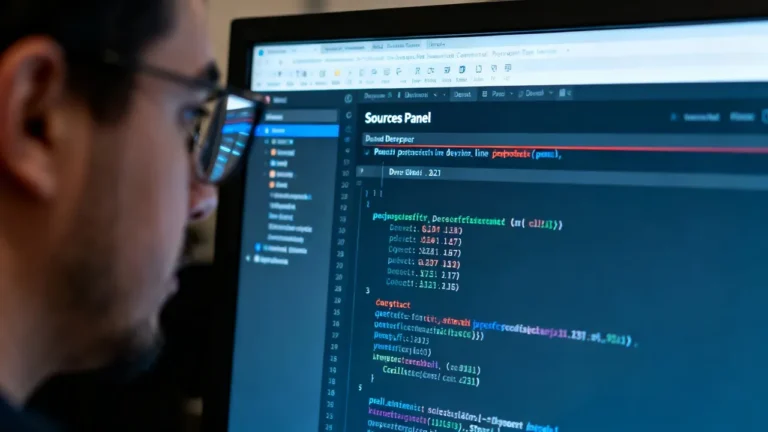
How to debug closures in JavaScript using DevTools

Debugging is essential for developers, and browser DevTools enhance the JavaScript debugging process. Key features include setting breakpoints, inspecting variables, and profiling code to identify performance bottlenecks. Utilizing these tools improves understanding of application behavior and streamlines issue resolution, leading to higher quality code.
How to use console.log and console.error in Node.js

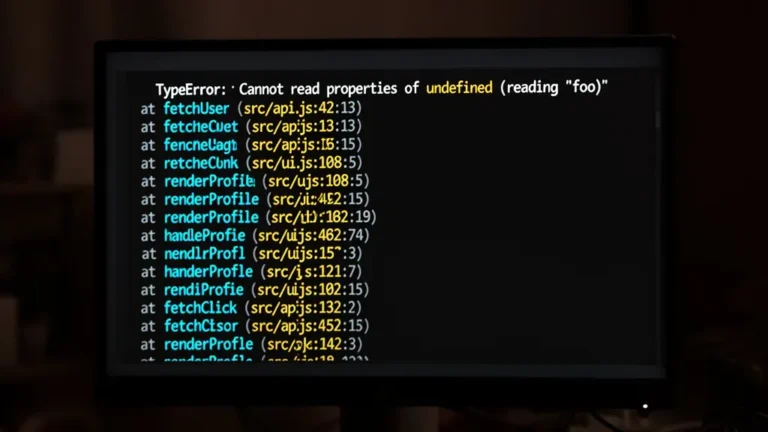
How to use console.log and console.error in Node.js

Console methods like console.log, console.error, and console.trace improve debugging by providing detailed output and stack traces. Conditional logging reduces noise, asynchronous logging enhances performance, and structured logging offers richer context. Integrating with monitoring tools and managing log retention supports effective application monitoring.
How to identify memory leaks in JavaScript

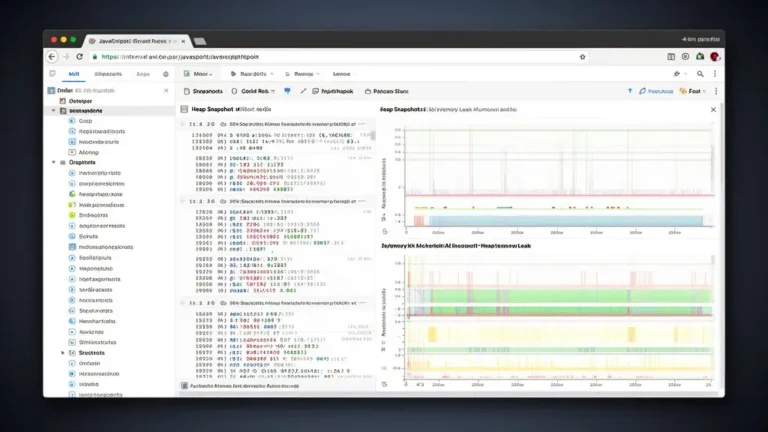
How to identify memory leaks in JavaScript

Memory leak prevention through effective coding practices is essential for optimal application performance. Key strategies include explicit component cleanup in SPAs, utilizing lifecycle methods in frameworks like React and Angular, avoiding global scope pollution, and leveraging WeakMaps for caching. Implementing these techniques ensures stable, efficient software.